Shoreline Change
Coastal managers in the New England use historic shoreline positions to assess the rates of shoreline change, erosion and deposition. Typically, this analysis uses historic topographic sheets or T-sheets for the derived shorelines approximate mean high water. The use of maps with shorelines that represent different features such as mean high water versus mean sea level, can introduce errors and inaccuracies in calculating shoreline change. The NOAA Coastal Services Center has an animated graphic that demonstrates how shorelines are used to calculate rates of change.
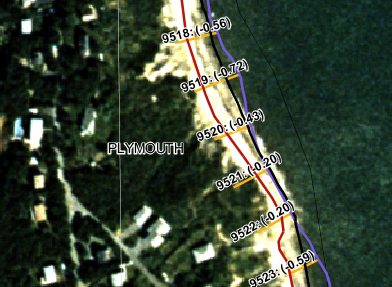 |
| Erosion rates in parenthesis (feet/year) at transects in Massachusetts. |
Sources of Shoreline Change Data:
- Connecticut - digital data for the 1880's T-sheets are available through the CT DEP Office of Long Island Sound Programs. Data for 2005/2006 are available from NOAA using the Shoreline Data Explorer.
- Massachusetts - shoreline data accessible via the Shoreline Change Map Browser
- Rhode Island - shoreline data are available as jpg downloads
Shoreline Change Tools:
- Digital Shoreline Analysis System (DSAS) is an ArcGIS extension for calculating shoreline change that is free at from the USGS. An abstract explaining the tool can be found here.
Shoreline Change Forecasting:
A summary of shoreline change forecasting methods is contained in Appendix 2 of the Synthesis and Assessment Product 4.1 entitled Coastal sensitivity to sea-level rise: A focus on the Mid-Atlantic Region produced by the U.S. Global Change Research Program.