Wind
Wind acts upon the ocean surface to create waves and waves approaching the shore create currents that in turn move or transport sediment (i.e., longshore transport). Wind-driven waves and associated currents can cause shoreline erosion. Strong winds associated with storms such as nor'easters or hurricanes cause water to 'pile-up' along the shore creating abnormally high water known as surge.
Ocean observations systems such as buoys equipped with weather sensors provide real-time information about offshore wind conditions and allow for the interpretation of the likelihood of building surges, the creation of waves with erosive potential and production of strong currents.
Real-time wind speed/direction/wind gust sensors:
 |
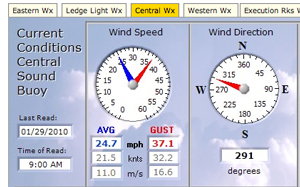 |
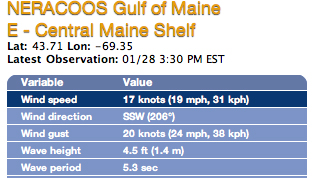
| Synopsis of weather data from Buoy E at the NERACOOS website. | Weather panel display for the Central Long Island Sound Buoy. |
- buoys in the NERACOOS domain
- tide gauges in the NERACOOS domain
- terrestrial weather platforms - in the nowCoast domain
Wind Forecast Models:
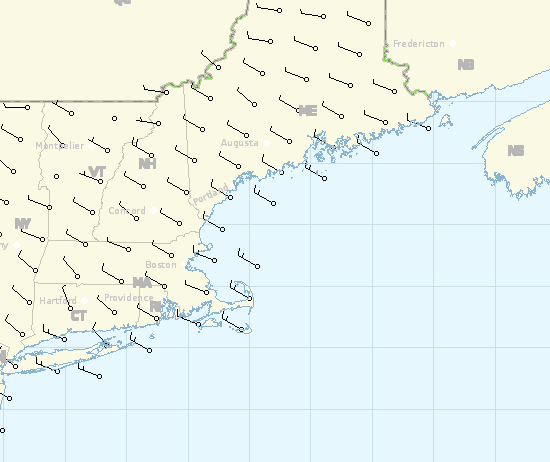
NDFD CONUS winds - The coterminus U.S. (CONUS) winds of the National Digital Forecast Database (NDFD). The database contains a seamless mosaic of digital weather forecasts from National Weather Service (NWS) field offices and the National Centers for Environmental Prediction (NCEP). The Storm Prediction Center (SPC) is the NWS’ center of expertise for forecasting convection, especially for life- threatening and economically-disruptive weather events such as tornadoes, large hail, and damaging winds. Every 3 hours out to 72 hours; every 6 hours out to 168 hours. Wind speed and direction is the expected sustained 10-meter wind speed/direction for the indicated hour, using 36 points of a compass (using 40 grids?).
RU COOL Meteorological Analysis and Forecast - includes southern New England
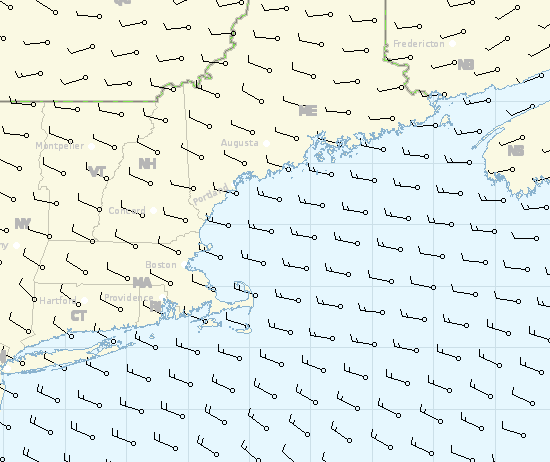
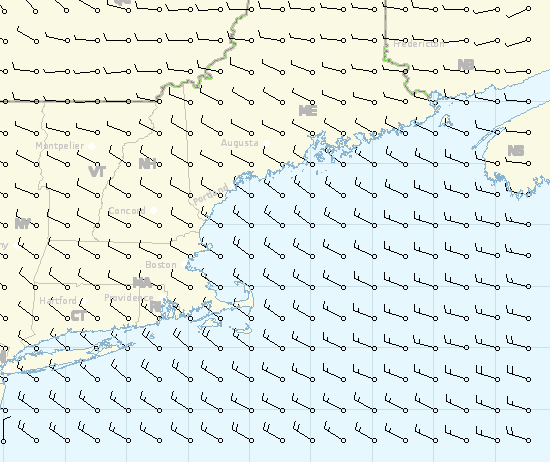
- Wind @ 10 meter
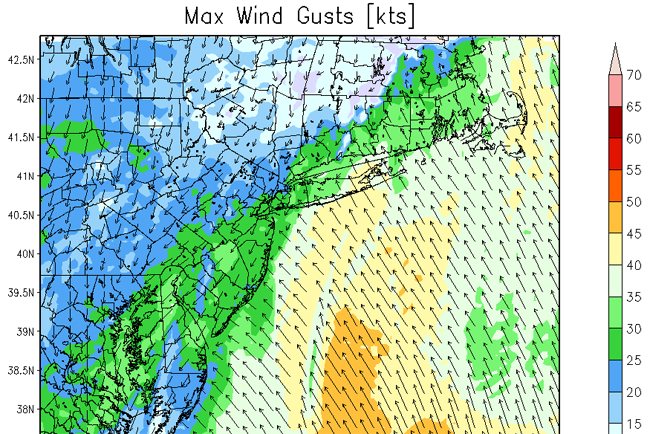
- Maximum wind gust @ 10 meters
Windrose Rose:
The Air Resources Laboratory has a program to generate a wind rose computed using gridded model forecast data for a single location within the meteorological model domain. Wind roses typically show the frequency of wind direction at a single location on a 16-point compass over an extended period of time (months to years). Since the use of the wind rose here only includes a few points in time, caution must be used when trying to interpret the plots in the typical sense of a wind rose. In addition, rings are plotted that represent the wind speed frequency for seven wind speed classes identified by color. Along the bottom of the plot is a graph of the wind direction versus model forecast hour to give information on when the winds will be from each sector. The color of the line indicates the wind speed at that forecast hour using the same color bands as in the wind rose.
This model can be used to anticipate surge generated by prolonged and intense winds.
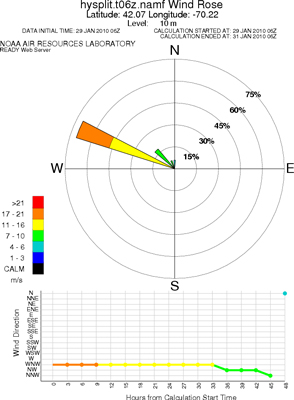 |
Windy conditions followed the passage of a storm on January 28 through New England that delivered snow. This forecast for Provincetown, MA shows wind speeds will exceed 17 mph for more than 45% of the time. The lower graph shows that winds will diminish over the next 48 hours but remain from the WNW direction. This should cause water to surge in Cape Cod Bay on the shore of Cape Cod. |
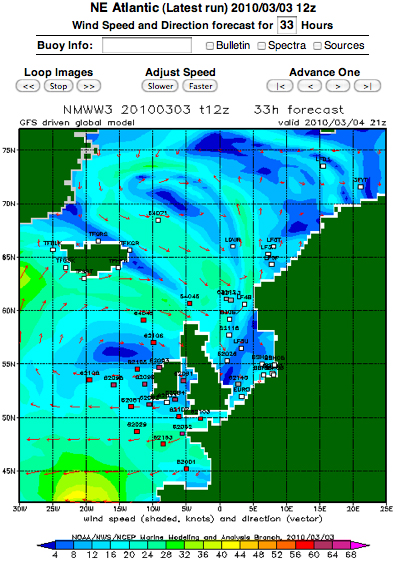
WaveWatchIII - wind viewer is an operational ocean wave predictions of NOAA/NWS/National Center for Environmental Predictions. View options include: significant wave height, wind sea wave height, primary swell wave height, secondary swell wave height, wind speed and direction, peak wave period, wind sea period, primary swell period and secondary swell period. For more detailed product descriptions.