WATER QUALITY
Real-time Observations:
- Chlorophyll A
- NERACOOS Gulf of Maine M (Jordan Basin)
- NERACOOS Gulf of Maine F (Penobscot Bay)
- NERACOOS Gulf of Maine E (Central Maine shelf)
- NERACOOS Gulf of Maine B (Western Maine shelf)
- NERACOOS Gulf of Maine F (Penobscot Bay)
- NERACOOS Gulf of Maine F (Appledore Island)
- NERACOOS Gulf of Maine A (Massachusetts Bay)
- NERACOOS Long Island Sound (Central LIS)
- Dissolved Oxygen: Low dissolved oxygen can have adverse impacts upon marine life organisms. Threshold values for certain consequences are described in an Long Island Sound Study fact sheet. Certain water bodies such as Narragansett Bay and Long Island Sound experience annual periods of prolonged low dissolved which is referred to as hypoxia when DO values are below 3 ppm. Occasionally, conditions are conducive (e.g., thermal stress and high runoff creating stratification) to the formation in isolated water bodies such as embayments. NERACOOS has two buoys designed for temporary inshore deployments to evaluate such aperiodic events. The most unusual low dissolved oxygen phemonenon are present in deep glacial but tidal kettle holes that are highly stratified where biogenic hydrogen sulfide accumulates, namely Frash Pond in Stratford, CTand the Pettaquamscutt River in Narragansett, Rhode Island. These are anoxic depressions persist for several years before the waterbodies overturn or ventilate. Buoys equipped with DO sensors include:
- Long Island Sound - execution rocks, western sound, central sound, and eastern sound buoys and two fixed moorings at Norwalk and Thames Rivers. Western LIS is the only Northeast buoy which records DO at three depths and is located in a hypoxia area. This array is providing new insights into the formation of hypoxia which are otherwise missed by biweekly cruises.
| |
|
|
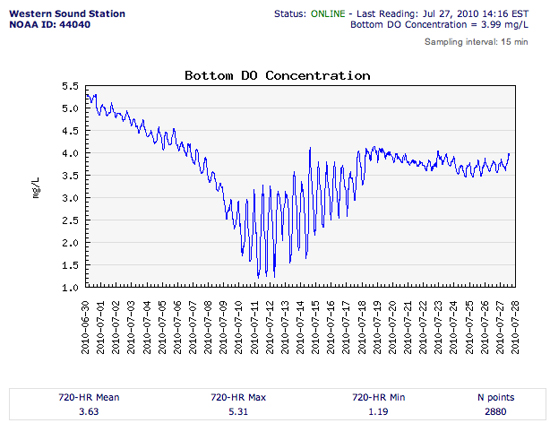
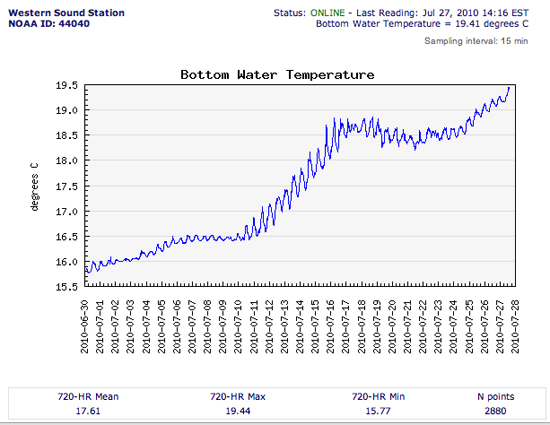
| DO and TEMP at the Western Sound Station (buoy) during the month of July 2010 showing the formation of hypoxia (values less than 3 ppm) and the corresponding trends in temperature. Daily |
|
- Narragansett Bay - The University of Rhode Island and RI Department of Environmental Protection deploy DO sensors at fixed moorings and buoys collecting DO date every 15 minutes from May to October but do not provide the data in a real-time mode.
- Gulf of Maine buoys: A, Appledore Island, Bowdoin, and fixed moorings at Great Bay and Wells NERR.
- NERR System Wide Monitoring Program -
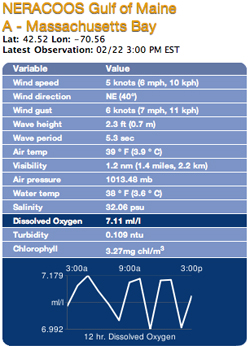 |
 |
| Dissolved oxygen value at 3:00 pm at Buoy A. |
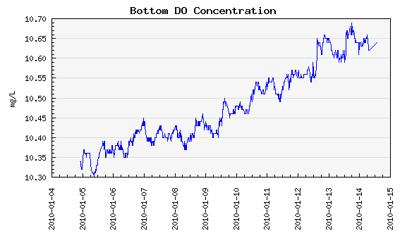
Western LIS Buoy is the only buoy with DO sensors deployed on surface, mid-depth and bottom in the NERACOOS region. Here is shown a graph of DO data for 14 days. |
- Nutrients - several nutrient sensors are being tested by University of Connecticut
- Ocean Acidification: The oceans have absorbed about 50% of the CO2 which has increased hydrogen ion (acidity) which is creating a process known as ocean acidification. The Pacific Marine Environmental Laboratory (PMEL)of NOAA is the national leader for ocean acidification has developed a sensor package to monitoring for this process. Background about ocean acidification is available through PMEL. PMEL has provided NERACOOS with two sensors. These are deployed at:
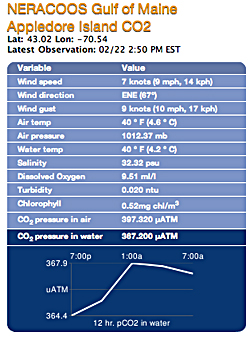
- Gulf of Maine Appledore Buoy
- Central Long Island Sound
|
| The new ocean acidification sensor at Appledore Island. |
- Salinity -
The majority of NERACOOS buoys and fixed moorings are providing real-time salinity and turbidity data.
- CT DEP recently funded the installation of two salinity gauges on the lower CT River to detect changes in the position of the salt water wedge from climate change. Sea level rise and reductions in the snow pack are expected to change the positionof the salt water wedge which could have adverse consequences on the area designated as Wetlands of International Importance under the Ramsar Convention. This project is a joint partnership between the University of Connecticut and CT USGS. The two stations include Old Lyme at the DEP Marine Headquarters and Essex (operational in spring 2010), a location at the freshwater/brackish surface water boundary. The Old Lyme gauge is providing new insights to daily flucutations in salinity during the summer season and for the rate of river discharge. These data may help UConn and USGS to assess water quality changes on the CT River and to Long Island Sound. The Connecticut River supplies nearly 70% of the surface freshwater discharge to the Sound.
Water Quality Cruises:
- Long Island Sound - Since 1994, the Connecticut Department of Environmental Protection, on behalf of the Long Island Sound Study, conducts a Long Island Sound Water Quality Monitoring Program. From October to May, water quality is monitored by collecting samples once a month from 17 sites by staff aboard the Department’s Research Vessel. Bi-weekly hypoxia surveys start in mid-June and end in September with up to 48 stations being sampled during each survey. View LIS Water Quality Monitoring Stations. UConn has assisted DEP in making their cruise data available on the web. The products include:
- Long Island Sound Ferry based observations at Bridgeport to Port Jefferson Ferry and New London to Orient Ferry.
- Narragansett Bay, Rhode Island -
- Atlantic Zone Monitoring Program - The Atlantic Zone Monitoring Program (AZMP) represents the minimum requirement to adequately detect and measure inter-annual variability over the Atlantic Canadian shelves and slopes. The AZMP was implemented in 1998 with the aim of collecting and analyzing the biological, chemical, and physical field data that are necessary to (1) characterize and understand the causes of oceanic variability at the seasonal, inter-annual, and decadal scales, (2) provide multidisciplinary data sets that can be used to establish relationships among the biological, chemical, and physical variables, and (3) provide adequate data to support the sound development of ocean activities.
Long Term Water Quality Data Collection
- Bedford Basin Plankton Monitoring Program - In 1991, a time series was established to record the weekly state of the plankton ecosystem in this basin adjacent to Halifax. The strategy of regular and perpetual sampling provides data to assess environmental variability at the weekly, monthly, seasonal, annual and decadal time scales. Water quality parameters include temperature, chlorophyll a, nitrate and CTD depth profiles.
- Atlantic Zone Monitoring Program - refer to link above. This program also has near shore fixed stations.
- Various LIS harbors?
- Massachusetts Water Resources Authority - Conducts long-term monitoring of nutrients, pathogens, metals, organics, solids, pH, oil and grease and toxicity of the effluent from the Deer Island treatment plant and several other CSO's facilities in the Boston area.
- Millstone/Dominion -
coliform monitoring for WQ and shellfish closures - identify these?
EPA Beach Water Quality (coliform?)
Northeast Fisheries Science Center Oceanography Branch - salinity, water temperature (cruises)
NEFSC Scientific Computer System (SCS) Alongtrack Data Processing - cruise track data include air temp, sea temp, salinity, fluorescence, wind speed, wind direction, humidity and baro-pressure.
eMOLT - Environmental monitors on lobster traps - temperature
Ship of opportunity Surveys
NOAA Mussel Watch Program
Corps DAMOS
ESIP - http://www2.gulfofmaine.org/esip/map/
http://www.gomoos.org/chameleon/gulfwatch/